Primer cuaderno de Jupyter#
Usaremos el datased ifood para evaluar la eficiencia de unas campañas publicitarias aplicadas en un restaurante.
Carga de datos#
Para cargar los datos debe hacer clic en el panel izquierdo en el botón de exploración de archivos. En ese menu tendra la opción de subir algunos datos.
import pandas as pd

# Load the dataset from the user's Google Drive
df = pd.read_csv("ifood_df.csv")

# Show DataFrame
df.head(5)
| Income | Kidhome | Teenhome | Recency | MntWines | MntFruits | MntMeatProducts | MntFishProducts | MntSweetProducts | MntGoldProds | ... | marital_Together | marital_Widow | education_2n Cycle | education_Basic | education_Graduation | education_Master | education_PhD | MntTotal | MntRegularProds | AcceptedCmpOverall | |
|---|---|---|---|---|---|---|---|---|---|---|---|---|---|---|---|---|---|---|---|---|---|
| 0 | 58138.0 | 0 | 0 | 58 | 635 | 88 | 546 | 172 | 88 | 88 | ... | 0 | 0 | 0 | 0 | 1 | 0 | 0 | 1529 | 1441 | 0 |
| 1 | 46344.0 | 1 | 1 | 38 | 11 | 1 | 6 | 2 | 1 | 6 | ... | 0 | 0 | 0 | 0 | 1 | 0 | 0 | 21 | 15 | 0 |
| 2 | 71613.0 | 0 | 0 | 26 | 426 | 49 | 127 | 111 | 21 | 42 | ... | 1 | 0 | 0 | 0 | 1 | 0 | 0 | 734 | 692 | 0 |
| 3 | 26646.0 | 1 | 0 | 26 | 11 | 4 | 20 | 10 | 3 | 5 | ... | 1 | 0 | 0 | 0 | 1 | 0 | 0 | 48 | 43 | 0 |
| 4 | 58293.0 | 1 | 0 | 94 | 173 | 43 | 118 | 46 | 27 | 15 | ... | 0 | 0 | 0 | 0 | 0 | 0 | 1 | 407 | 392 | 0 |
5 rows × 39 columns
Exploración de datos#
Vamos a explorar los datos para entender su estructura y contenido.
# Ayudame a ver las filas de la 20 a la 30 de df

df.iloc[20:31]
| Income | Kidhome | Teenhome | Recency | MntWines | MntFruits | MntMeatProducts | MntFishProducts | MntSweetProducts | MntGoldProds | ... | marital_Together | marital_Widow | education_2n Cycle | education_Basic | education_Graduation | education_Master | education_PhD | MntTotal | MntRegularProds | AcceptedCmpOverall | |
|---|---|---|---|---|---|---|---|---|---|---|---|---|---|---|---|---|---|---|---|---|---|
| 20 | 2447.0 | 1 | 0 | 42 | 1 | 1 | 1725 | 1 | 1 | 1 | ... | 0 | 0 | 0 | 0 | 1 | 0 | 0 | 1729 | 1728 | 0 |
| 21 | 58607.0 | 0 | 1 | 63 | 867 | 0 | 86 | 0 | 0 | 19 | ... | 0 | 0 | 0 | 0 | 0 | 0 | 1 | 953 | 934 | 1 |
| 22 | 65324.0 | 0 | 1 | 0 | 384 | 0 | 102 | 21 | 32 | 5 | ... | 0 | 0 | 0 | 0 | 0 | 0 | 1 | 539 | 534 | 0 |
| 23 | 40689.0 | 0 | 1 | 69 | 270 | 3 | 27 | 39 | 6 | 99 | ... | 1 | 0 | 0 | 0 | 1 | 0 | 0 | 345 | 246 | 0 |
| 24 | 18589.0 | 0 | 0 | 89 | 6 | 4 | 25 | 15 | 12 | 13 | ... | 0 | 0 | 0 | 0 | 1 | 0 | 0 | 62 | 49 | 0 |
| 25 | 53359.0 | 1 | 1 | 4 | 173 | 4 | 30 | 3 | 6 | 41 | ... | 0 | 0 | 0 | 0 | 1 | 0 | 0 | 216 | 175 | 0 |
| 26 | 38360.0 | 1 | 0 | 26 | 36 | 2 | 42 | 20 | 21 | 10 | ... | 0 | 0 | 0 | 0 | 1 | 0 | 0 | 121 | 111 | 0 |
| 27 | 84618.0 | 0 | 0 | 96 | 684 | 100 | 801 | 21 | 66 | 0 | ... | 0 | 0 | 0 | 0 | 0 | 0 | 1 | 1672 | 1672 | 1 |
| 28 | 10979.0 | 0 | 0 | 34 | 8 | 4 | 10 | 2 | 2 | 4 | ... | 0 | 0 | 0 | 0 | 0 | 1 | 0 | 26 | 22 | 0 |
| 29 | 38620.0 | 0 | 0 | 56 | 112 | 17 | 44 | 34 | 22 | 89 | ... | 1 | 0 | 0 | 0 | 0 | 1 | 0 | 229 | 140 | 0 |
| 30 | 40548.0 | 0 | 1 | 31 | 110 | 0 | 5 | 2 | 0 | 3 | ... | 1 | 0 | 0 | 0 | 1 | 0 | 0 | 117 | 114 | 1 |
11 rows × 39 columns
Hagamos una descripicón de los datos interesnates, en este caso, la descripción de las columnas: Income, Recency, Kidhome y Teenhome.
columnas = ['Income','Recency','Kidhome','Teenhome']

# Veamos información de las columnas seleccionadas

df[columnas].describe()
| Income | Recency | Kidhome | Teenhome | |
|---|---|---|---|---|
| count | 2205.000000 | 2205.000000 | 2205.000000 | 2205.000000 |
| mean | 51622.094785 | 49.009070 | 0.442177 | 0.506576 |
| std | 20713.063826 | 28.932111 | 0.537132 | 0.544380 |
| min | 1730.000000 | 0.000000 | 0.000000 | 0.000000 |
| 25% | 35196.000000 | 24.000000 | 0.000000 | 0.000000 |
| 50% | 51287.000000 | 49.000000 | 0.000000 | 0.000000 |
| 75% | 68281.000000 | 74.000000 | 1.000000 | 1.000000 |
| max | 113734.000000 | 99.000000 | 2.000000 | 2.000000 |
Gráficos de distribución#
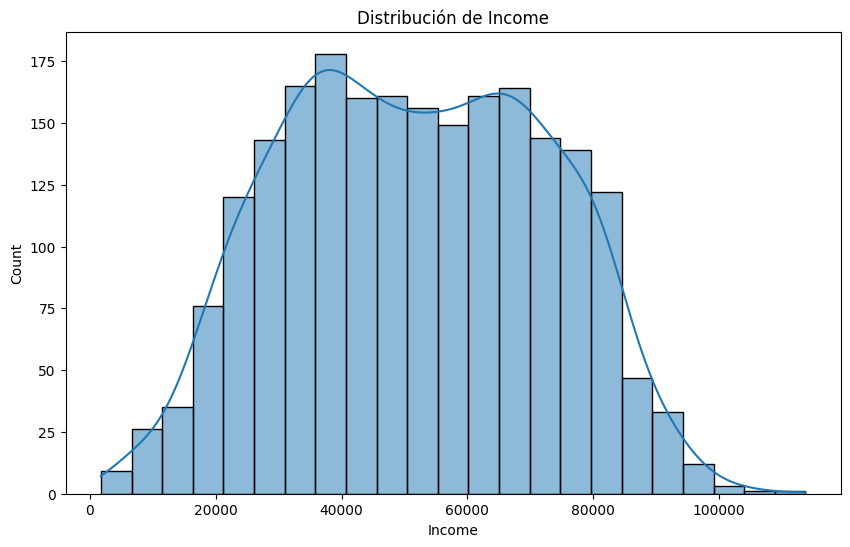
Sabemos por nuestros cursos de estadística que los histogramas son una buena forma de entender la distribución de los datos. Hagamos un histograma para cada una de las variables mencionadas.
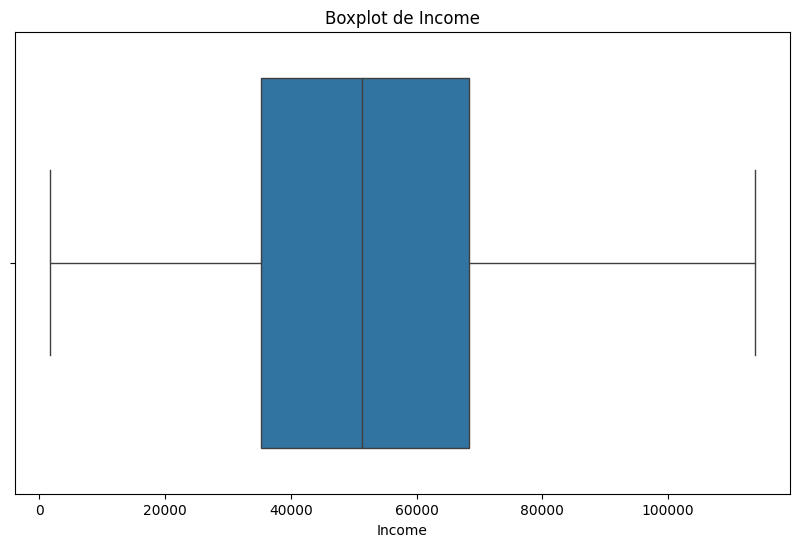
Income:
import pandas as pd
import matplotlib.pyplot as plt
import seaborn as sns

# Descripción de la variable 'Income'
print(df['Income'].describe())

# Histograma de la variable 'Income'
plt.figure(figsize=(10, 6))
sns.histplot(df['Income'], kde=True)
plt.title('Distribución de Income')
plt.show()

# Boxplot de la variable 'Income'
plt.figure(figsize=(10, 6))
sns.boxplot(x=df['Income'])
plt.title('Boxplot de Income')
plt.show()
count      2205.000000
mean      51622.094785
std       20713.063826
min        1730.000000
25%       35196.000000
50%       51287.000000
75%       68281.000000
max      113734.000000
Name: Income, dtype: float64
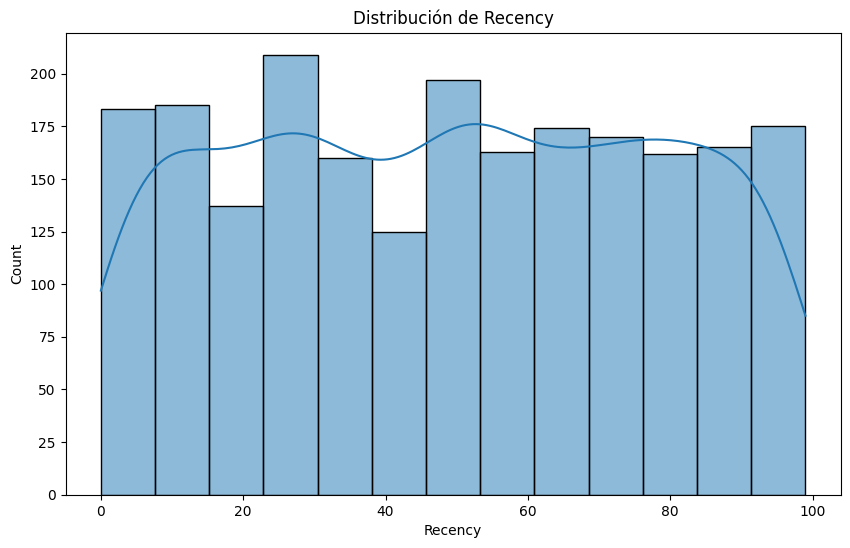
Recency:
## Describe la variable 'Recency'
print(df['Recency'].describe())

# Histograma de la variable 'Recency'
plt.figure(figsize=(10, 6))
sns.histplot(df['Recency'], kde=True)
plt.title('Distribución de Recency')
plt.show()

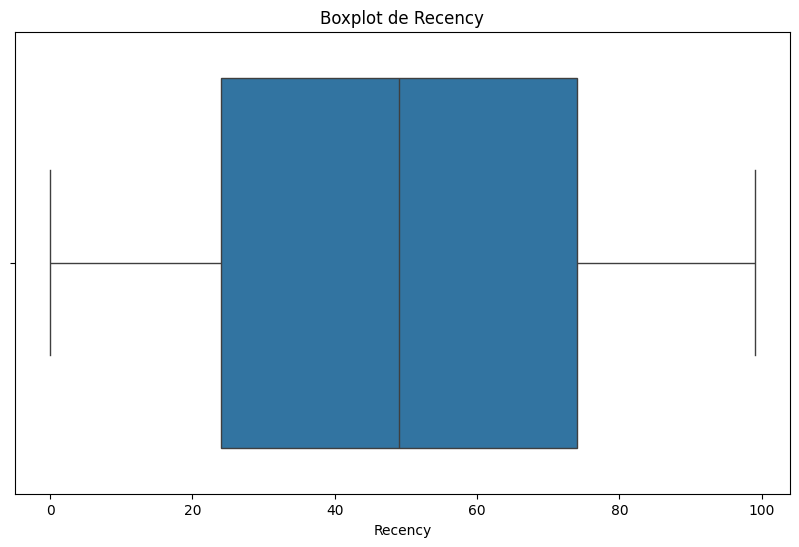
# Boxplot de la variable 'Recency'
plt.figure(figsize=(10, 6))
sns.boxplot(x=df['Recency'])
plt.title('Boxplot de Recency')
plt.show()
count    2205.000000
mean       49.009070
std        28.932111
min         0.000000
25%        24.000000
50%        49.000000
75%        74.000000
max        99.000000
Name: Recency, dtype: float64
Note
Observe que la sintáxis para hacer un histograma es la siguiente:
import matplotlib.pyplot as plt
plt.hist(dataframe['columna'], bins=30)
plt.show()
La columna Recency se puede cambiar por cualquier otra columna que se desee analizar.
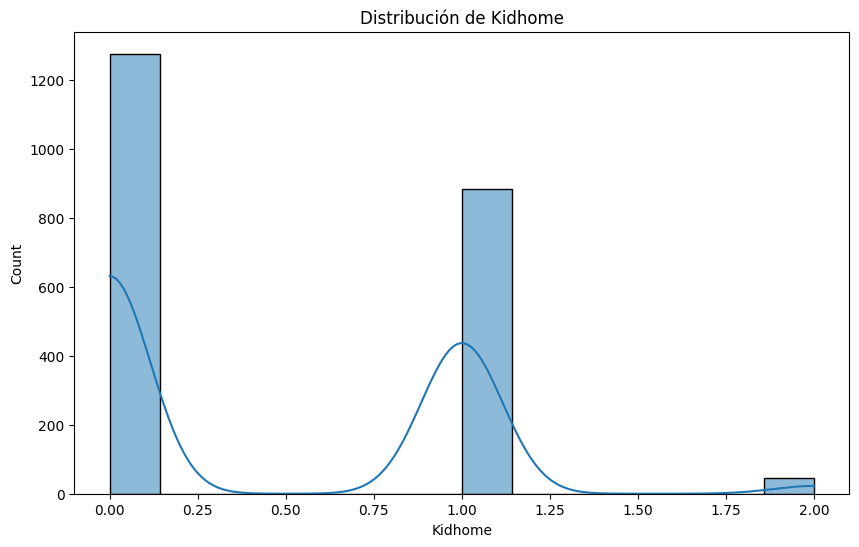
Kidhome:
## Describe la variable 'Kidhome'
print(df['Kidhome'].describe())

# Histograma de la variable 'Kidhome'
plt.figure(figsize=(10, 6))
sns.histplot(df['Kidhome'], kde=True)
plt.title('Distribución de Kidhome')
plt.show()

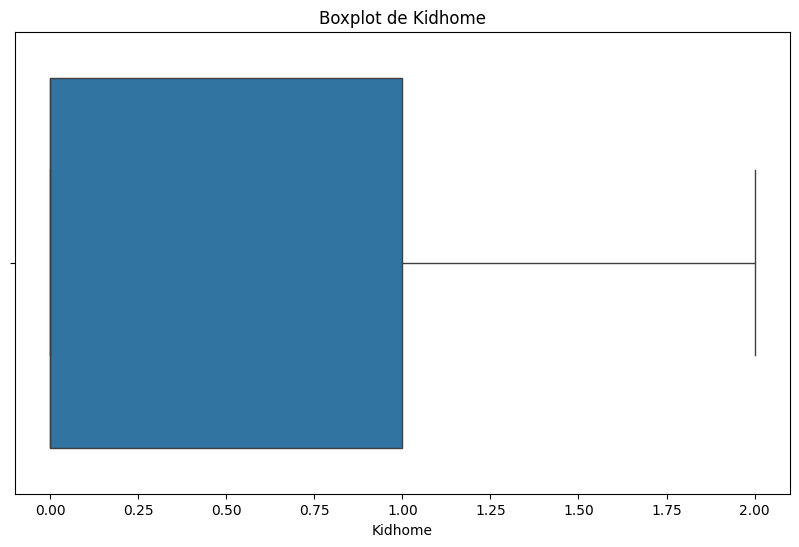
# Boxplot de la variable 'Kidhome'
plt.figure(figsize=(10, 6))
sns.boxplot(x=df['Kidhome'])
plt.title('Boxplot de Kidhome')
count    2205.000000
mean        0.442177
std         0.537132
min         0.000000
25%         0.000000
50%         0.000000
75%         1.000000
max         2.000000
Name: Kidhome, dtype: float64
Text(0.5, 1.0, 'Boxplot de Kidhome')
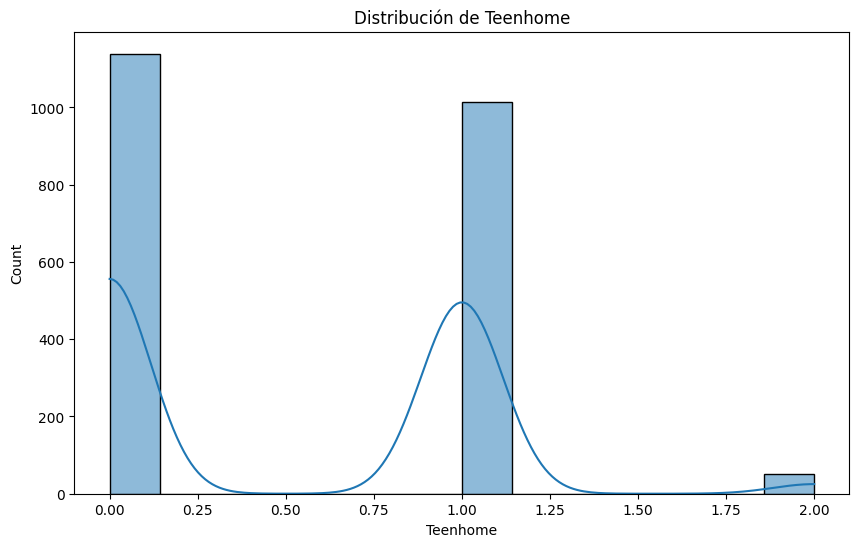
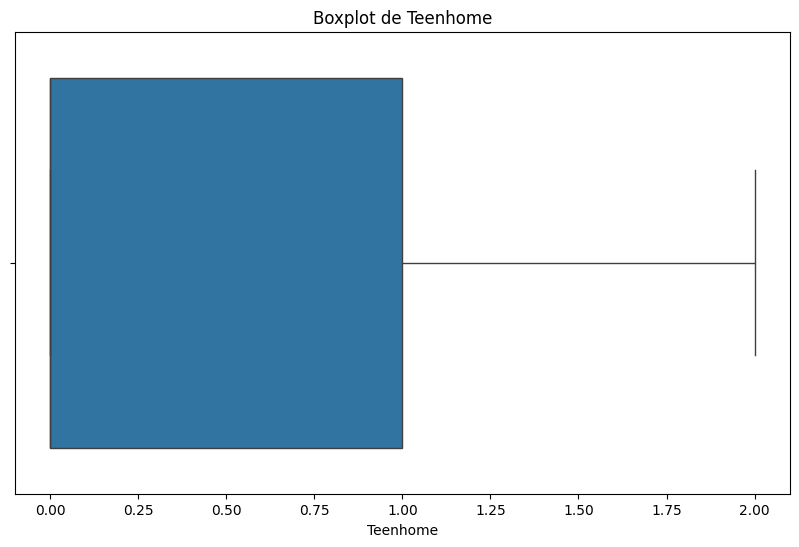
Teenhome:
## Describe la variable 'Teenhome'
print(df['Teenhome'].describe())

# Histograma de la variable 'Teenhome'
plt.figure(figsize=(10, 6))
sns.histplot(df['Teenhome'], kde=True)
plt.title('Distribución de Teenhome')
plt.show()

# Boxplot de la variable 'Teenhome'
plt.figure(figsize=(10, 6))
sns.boxplot(x=df['Teenhome'])
plt.title('Boxplot de Teenhome')
plt.show()
count    2205.000000
mean        0.506576
std         0.544380
min         0.000000
25%         0.000000
50%         0.000000
75%         1.000000
max         2.000000
Name: Teenhome, dtype: float64
